Correlations
Correlations are the heart of Intestigator. They show you which foods or drinks tend to precede your symptoms.
What You'll See
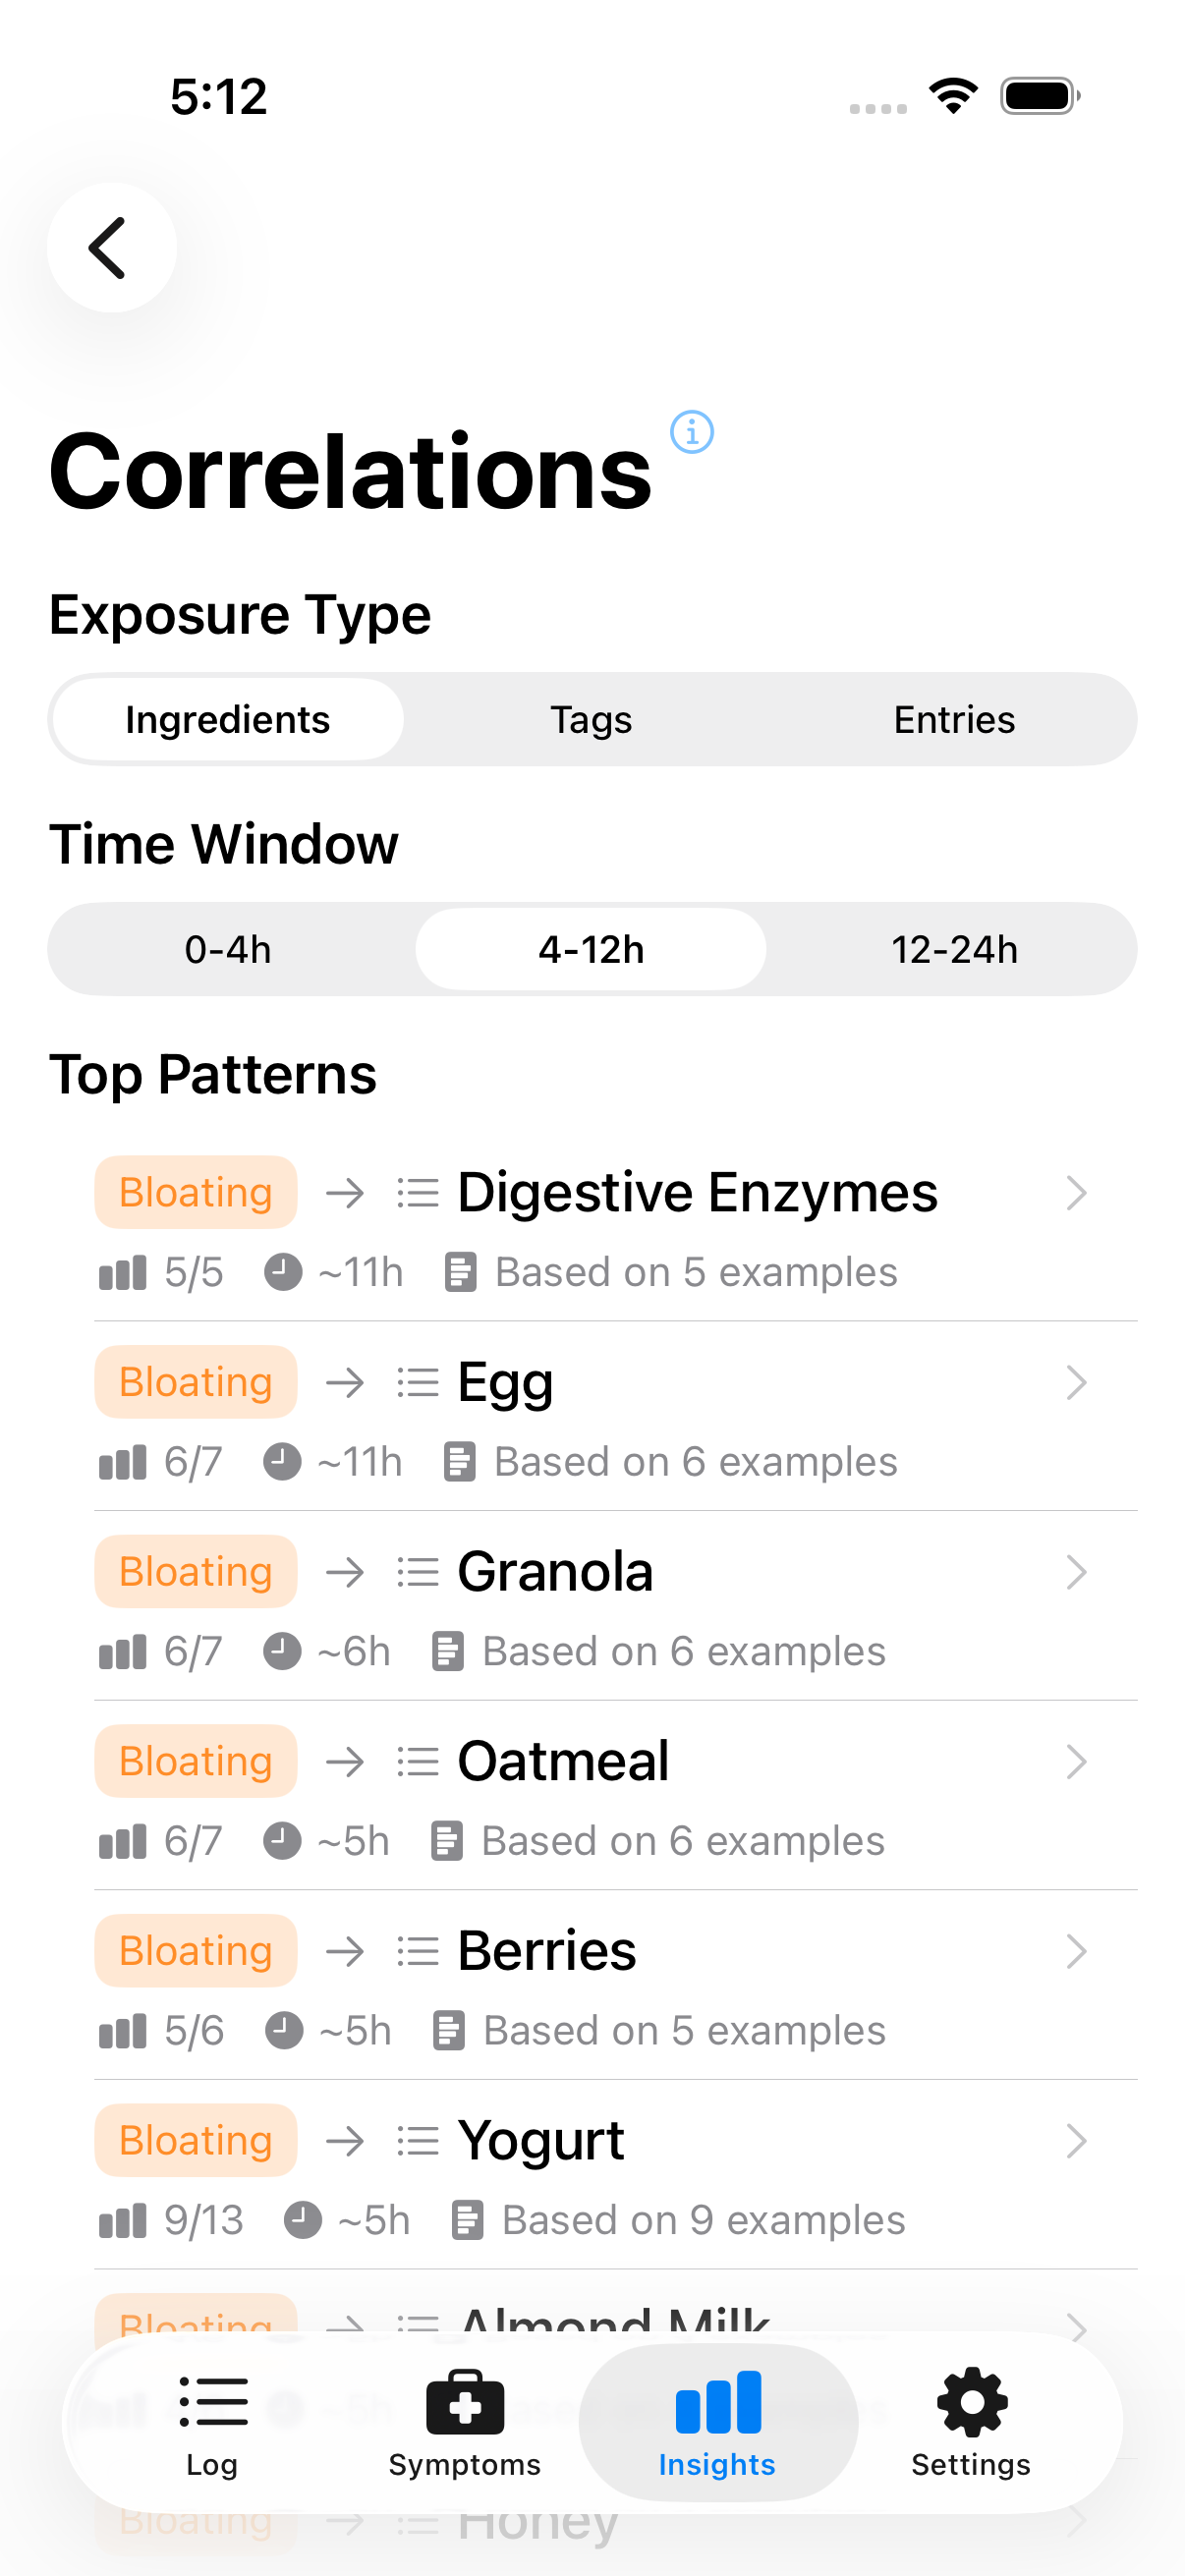
The correlations view shows potential food-symptom connections
Each correlation shows something like:
Bloating often follows Dairy 5 of 8 dairy exposures Typical delay: ~2 hours Based on 5 examples
This means: Out of the 8 times you logged dairy, bloating followed 5 of those times within a few hours. The typical gap between eating dairy and feeling bloated was about 2 hours.
How Correlations Are Calculated
Intestigator looks at your logs and asks: "When this person logged [symptom], what did they eat in the hours before?"
It then counts how often each food category appears before each symptom type. If a pattern shows up enough times, it becomes a correlation.
Time Windows
You can adjust the time window Intestigator uses:
| Window | Good For |
|---|---|
| 0–4 hours | Quick reactions (like caffeine or spicy food) |
| 4–12 hours | Most digestive symptoms (default) |
| 12–24 hours | Slower reactions |
Try different windows if you suspect your symptoms have unusual timing.
Analysis Modes
You can analyze correlations using three different modes:
- Ingredients — Analyzes specific items you've added to your meals (this is the default)
- Tags — Groups foods by category (dairy, gluten, caffeine, etc.)
- Descriptions — Looks for patterns in your meal description text
Choosing the Right Mode
Ingredients works best when you've been consistently adding individual items to your food entries. It gives you the most precise results because it tracks exactly what you ate.
Tags is helpful when you want a broader view. If you suspect "something with dairy" causes issues but aren't sure which specific dairy product, tag analysis groups everything together.
Descriptions analyzes the names you give your entries (like "Pepperoni Pizza" or "Morning Smoothie"). It groups similar descriptions together and looks for patterns, which can surface connections when you haven't added tags or ingredients.
Automatic Fallback
When you first open correlations, Intestigator tries to find meaningful patterns automatically:
- It starts with Ingredients (the most specific)
- If no patterns emerge, it falls back to Tags (broader categories)
- If still nothing, it tries Descriptions (entry names)
So if you notice the mode has changed from what you expected, it's because the app found better results in a different mode. You can always switch manually using the mode picker.
Viewing Examples
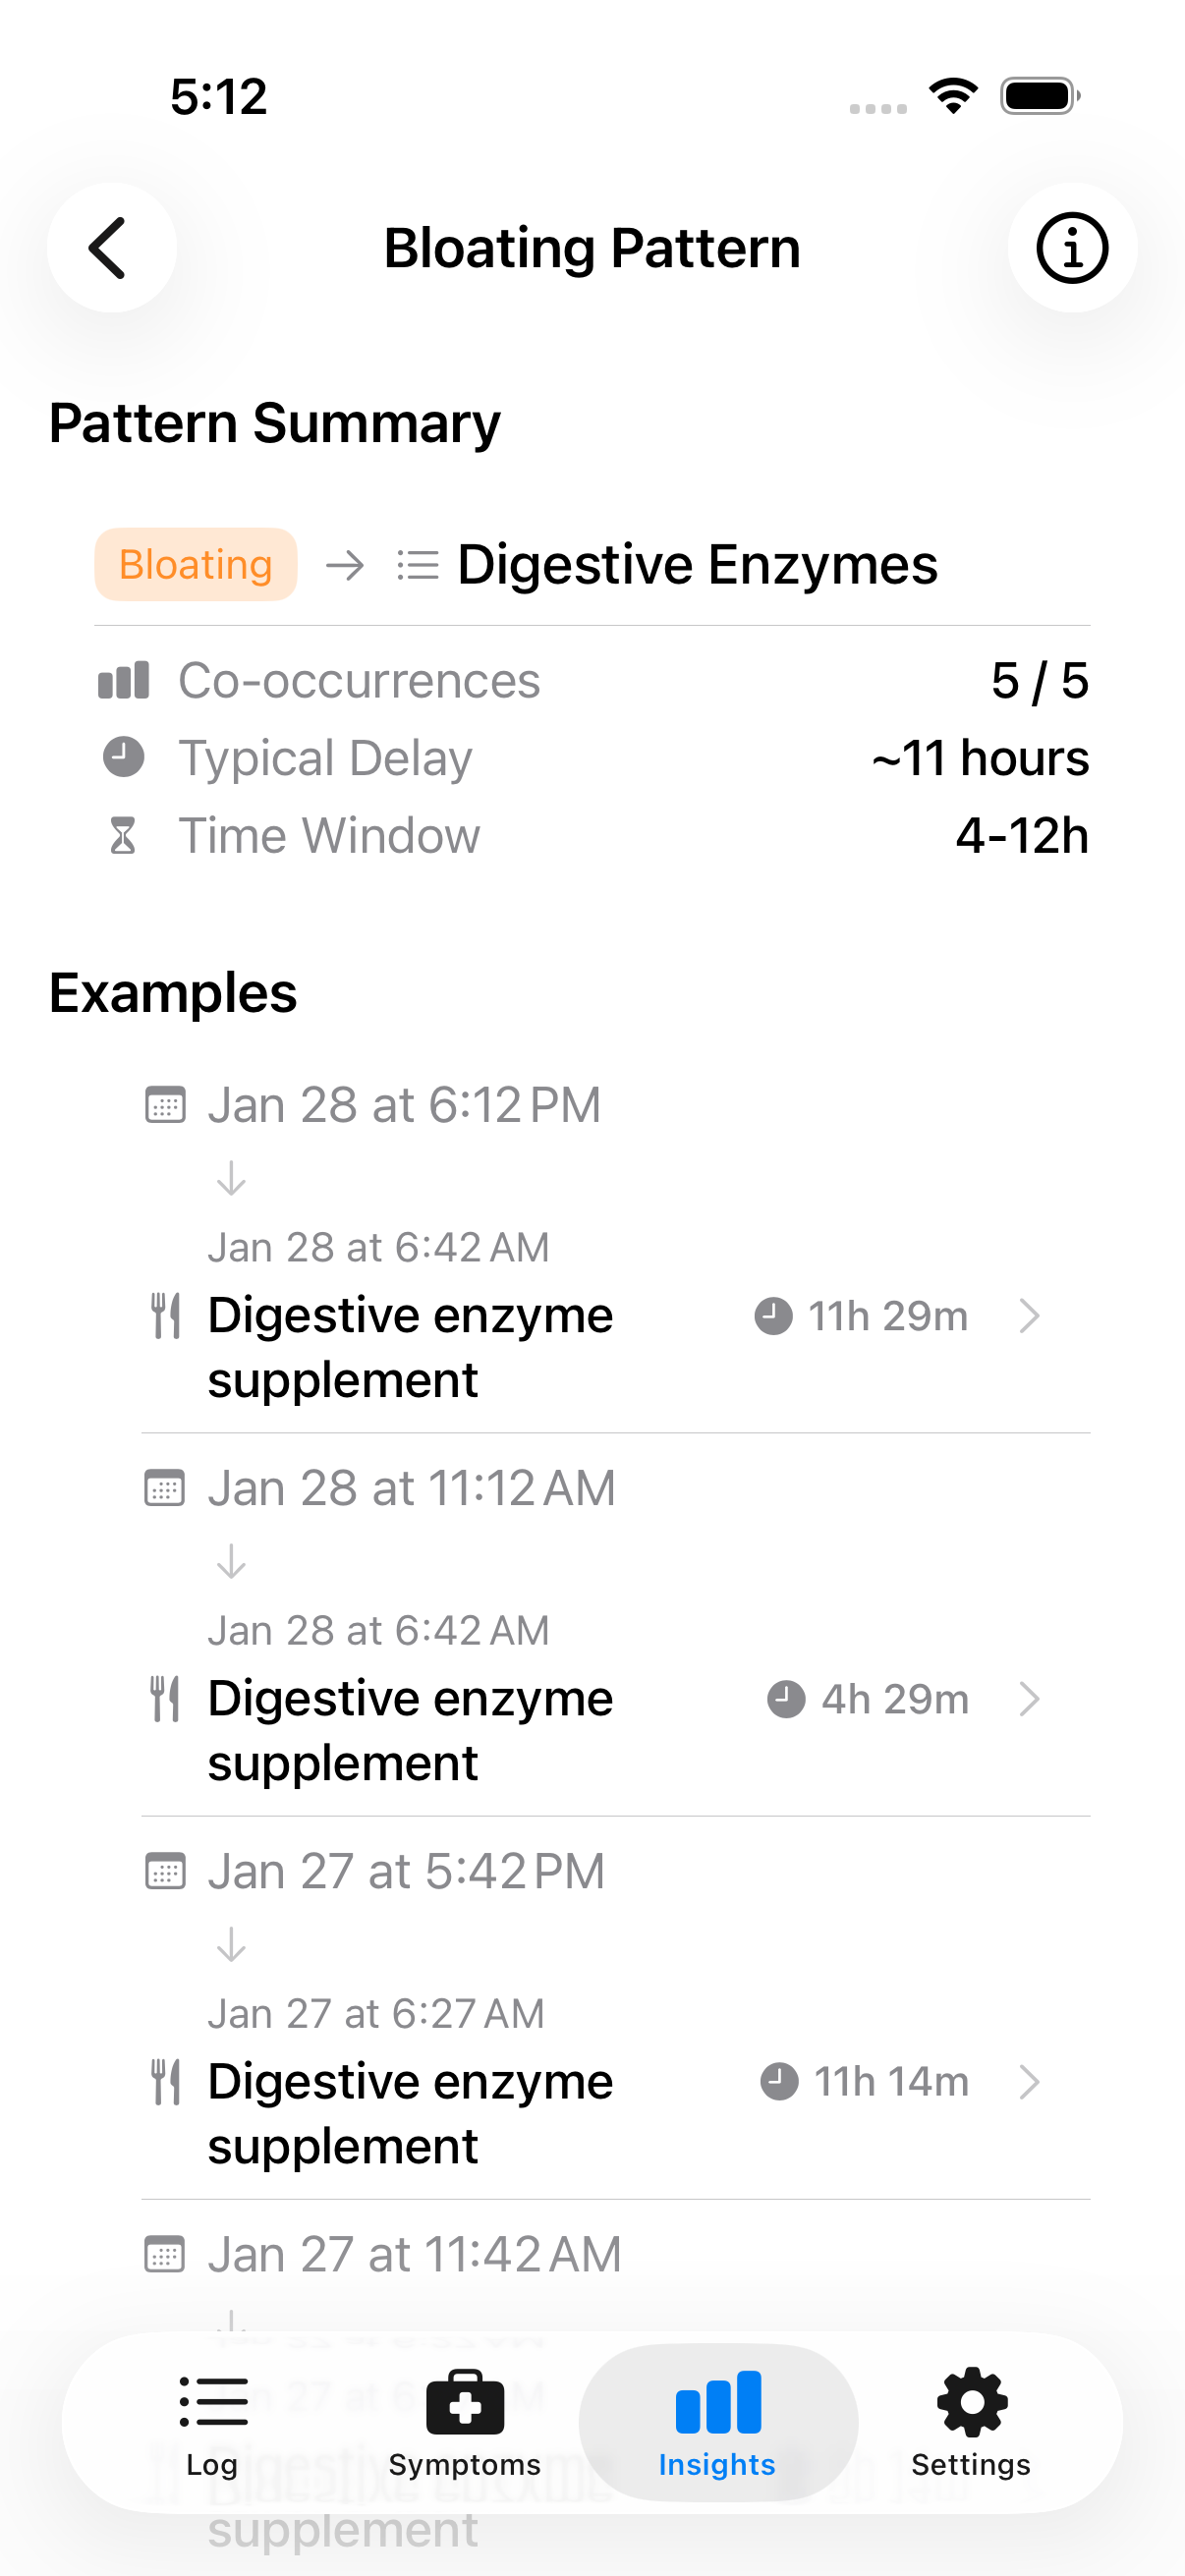
Tap a correlation to see specific food-symptom instances
Tap any correlation to see the actual entries that created it:
Example 1 Ate: Cheese pizza (12:30 PM) Felt: Bloating (3:15 PM) Delay: 2 hours 45 minutes
This lets you verify the pattern makes sense and recall specific incidents.
Minimum Requirements
Correlations only appear when there's enough data: - At least 3 times the symptom followed the food - At least 5 total exposures to that food category
This prevents false patterns from small sample sizes.
What Correlations Don't Mean
A correlation is not proof of cause and effect. It means "these two things often happen together in your data." Possible explanations: - The food actually triggers the symptom - Something else you eat with that food triggers it - The timing is coincidental - A third factor affects both
Use correlations as clues to investigate, not as diagnoses.
Next: Learn about Trends.